
With all bar 2 of the OBS collected, survey line 1 is complete, we set sail into international waters where we’ll begin our remaining 2 survey lines. Sadly the seas – up to 5800m deep -did not favour a couple of the instruments and we have to press on without them. After 12 days at sea, all the watch keep team are settled into the 24hr working ship day and during some of the quieter watch keep shifts during OBS recovery, we have begun to appreciate the little things. This week was Ben’s birthday and a surprise cake at dinner was more than welcome! I also discovered the ships bond – only open for 30 minutes 3 days a week, the ships bond is a cupboard like Willy Wonka’s chocolate factory. Packed with all sorts of goodies to buy, 2 weeks away from home and Dairy Milk has never tasted so good!
The transit out to the next two survey lines is around 24hrs. Aside from the capability to tow over 3km of hydrophones behind the vessel in order to record seismic data, the RRS James Cook is equipped to record a number of other geophysical measures. As well as a mounted gravimeter on board, a long period of constant sailing like this is a great time to deploy the magnetometer. Where the seismic data will look to examine the subsurface with depth, we can often tie in the magnetic signal and gravity strength at the surface to consolidate some of our interpretations.
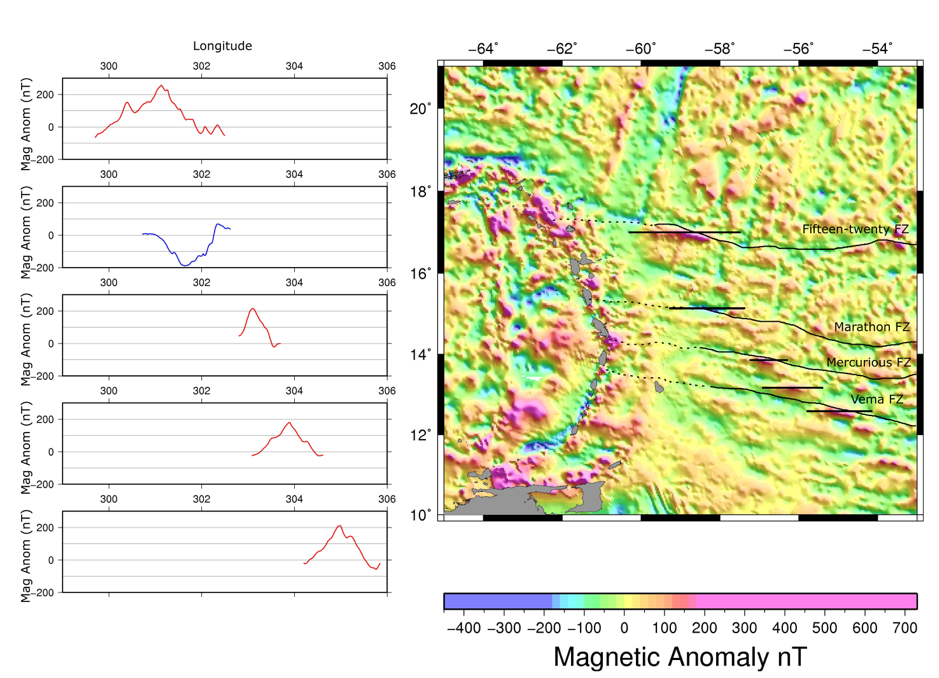
So how does a magnetometer work and what exactly does a magnetic signal characterise in somewhere like the Antilles? A magnetometer will record a “total magnetic field” (in units of nano Teslas, nT). This will be the sum of the background magnetic field of the Earth and the signal produced by the rocks and other objects around. The background magnetic field of the Earth is what you measure on a compass for navigation and on a much bigger scale, it acts to protect us from influxes of solar radiation. It also is highly changeable and there are a number of different global models which represent this field. We can use one of these models to subtract from the total field we have recorded and the value left over is what we consider as our “anomaly”.
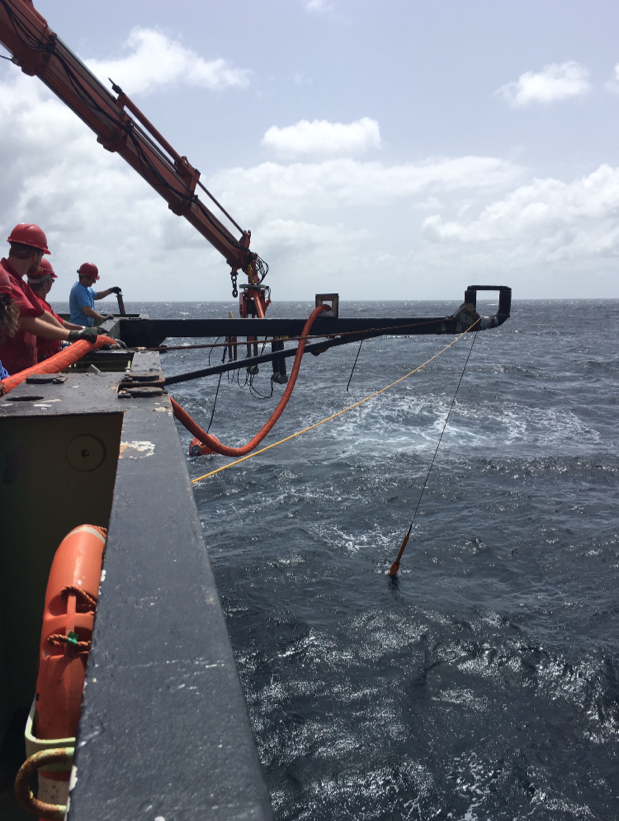
Our trusty ‘Maggie’ being deployed with one of the airgun beams in the background. It is let out on a line of around 300m so it does not lie too close to anything metallic (like the ship or towed equipment) which may interfere with the magnetic signal.
Typically, not many rocks are magnetic and so a strong anomaly signal is normally a good diagnostic feature for something a bit unusual in the target rocks. We gave seen from maps of the sea floor that the Mid-Atlantic ridge is sheared or torn, perpendicular to the direction of the ridge itself. These transform faults and fracture zones add complexities to the system. In general, in geology a fault implies one rock type has been forced adjacent to another rock type that may not naturally form together in sequence. In the Atlantic the crust is very thin and transform faults cause rocks from the mantle to be exposed at the surface. These mantle rocks contain minerals that tend to be more iron (Fe) based than silicic (SiO4) as rocks at the sea bed usually are. We have previously introduced the idea that these fracture zones can be channels for water to get into the Earth, and the way that water reacts with key minerals like olivine (Mg2SiO4 or Fe2SiO4) and serpentinite generates very characteristic features. Adding water to these minerals causes a process called “serpentinisation” and the mineral magnetite is produced in its place. As the name might suggest, the presence of this will tend to generate a very strong magnetic signal. As we now venture out onto the incoming American plate, we’ll be looking for these strong signals close to and parallel to the fracture zones.
As we deployed the magnetometer this week I was able to go out and watch the process myself. Head to toe in Personal Protective Equipment (PPE) – safety first on back deck, of course – I looked on as the deck crew manoeuvred the Maggie with the crane off the port side. Having worked with magnetic data in the Caribbean before, this was a satisfying round up to my MSci project work.
One of my favourite things about geophysics is the way lots of different techniques and methods can be used collectively to examine the same problem and (hopefully!) consolidate some ideas and hypotheses. Seismic imagining is a powerful technique but we should not underestimate some of the other tools we have at our disposal. By deploying the magnetometer whenever we get the chance we are adding to the density of data we have in this area and improve the accuracy of our models and maps. Survey line one? Check! International waters and stages 2 and 3? We’re on our way!